

By Jahnavi Kachina, IDEAS
Wayfair is an America E-Commerce fast-growing company for selling furniture and home goods online. As of January 2014, Wayfair was the largest retailer store for furniture and goods in the United States, and 33rd Largest for an online retailer in the United States [1]. The company also has generated profit as shown in figure1 a). but the company is not able to make a profit since 2014 it went to the public according to figure1 b).
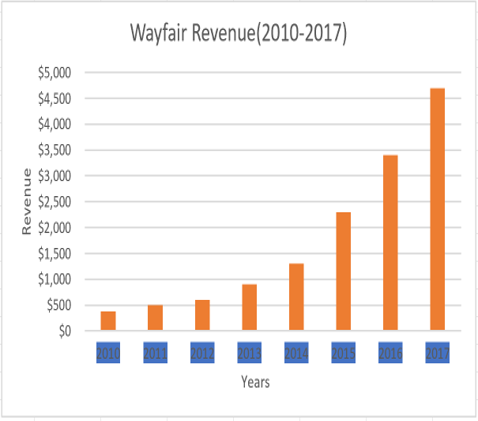
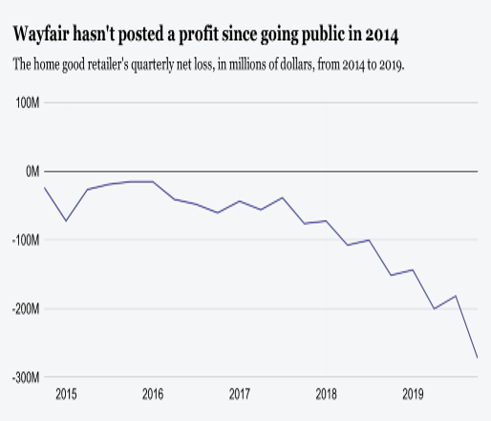
On 14th February company has announced a laying-off total of 550 employees including 350 from the Boston headquarter. The CEO of the company has confessed that the company invested money in different areas in an uneven amount. For example, advertisement, hiring new employees and investing profit back into the business for growth. This shows the company focused on short term management rather than the long term. To add, the company hired almost fourth-fold employees after 2016. The second bad investment is the advertisement, they spend money on marketing and advertisement that were not profitable. The company is successfully grown to remarkable size from the year 2002 to 2014. Although, the company invested most of the revenue back to grow the company bigger and bigger. Even though Wayfair has steady customer demand but the revenue graph as shown in above figure1 is not been impressive. It confessed by Edward Yruma “Wayfair has a very powerful consumer offering, but profitability remains even more elusive,” analyst Edward Yruma wrote at the time. That is true because selling furniture and shipping is more expensive than compared to Amazon’s products. The below paragraphs will provide information about Wayfair data science advancement [2].
Jupyter-friendly Data-science tools at the Wayfair:
Wayfair data-science tools have major two advantages 1) It allows new users to get onboard on an existing project from day one. 2) Allows self-serve a small handful of functions to implement a new project. Wayfair has developed data-science software in three sections.
Section 1: RoSE (Room and Style Estimator)
To understand customers, need, Wayfair uses RoSE computer vision to identify customer’s test based on the image. RoSE is a VGG network [1] trained on over 800k room images. Customers select one style from given Images and based on features RoSE can make decisions [3].
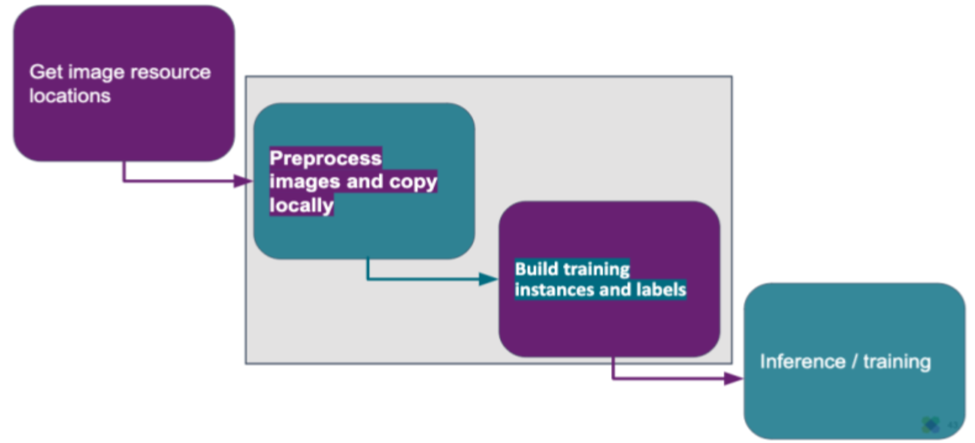
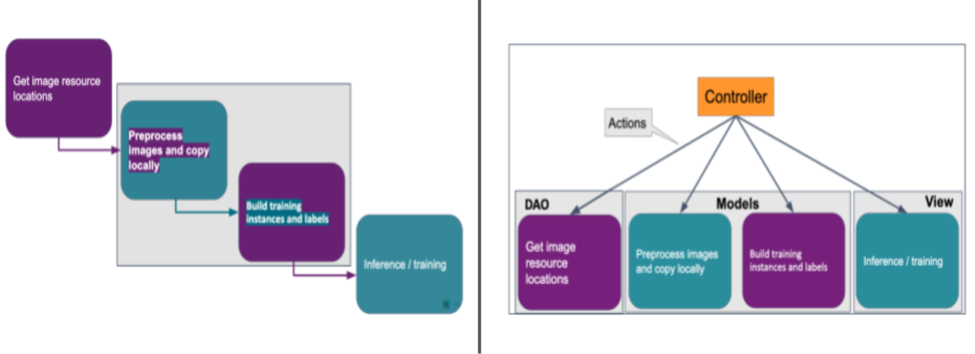
Break down the pipeline into four steps:
- Get image resource locations and other metadata: Collecting data in the form of query.
- Pre-process images and copy locally: Applying Pre-processing functions to the image and save it for training, e.g. scaling, padding, perturbing, etc.
- Build training instances and labels: Here RoSE there are two approaches.
- Predicts which style won most of the majority of experts’ votes.
- Identifies the top two images from them.
- Perform inference/training: Uses Keras generators that create image batches more quickly than they are consumed in a background process.
Section 2 : MVC(Model-view-controller) Framework
The basic thee components of MVC are Controller takes input from users, Model understands the required steps to do, and View replies to the user through the application. This is built to provide customer satisfactory experience that their product will be delivered safely [3].
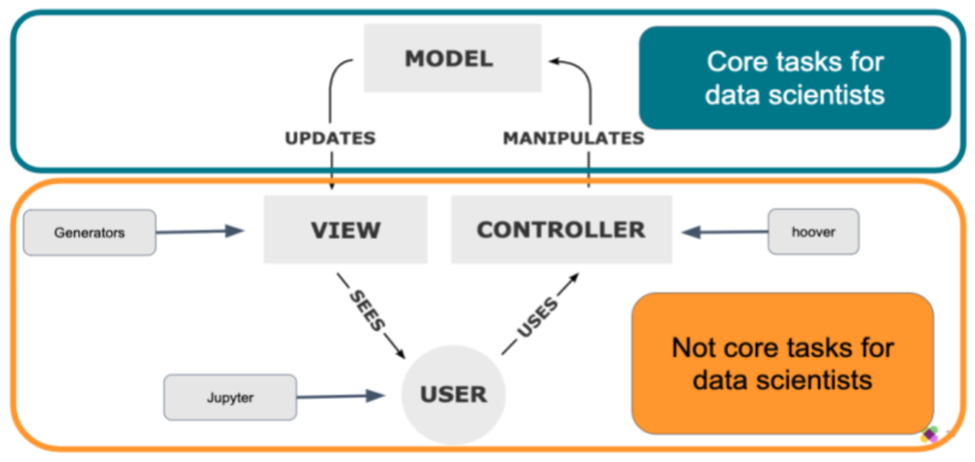
Inside the MVC framework, there are three major components
- Controller: User’s instruction for the application what short of actions required. For example, the checkout button.
- Model: Guidelines of how to take those actions. For example, backend integrations with order processing.
- View: The response from application to the user. Such as, loading confirmation of order page, and sending an email of confirmation.
Section 3: Hoover—Image Ingestion Pipeline Client
In this section, its controllers control actions based on the user to save each change into the database called “controller actions”. Data scientists import all the controllers into their notebook to perform all the actions in sequence [3].
The tool creation workflow can be described as
- Divide the whole process into sub sections
- Separate the sub sections where data science efforts are required.
- Map those sub sections into MVC data frame
The functions used in each specific project live alongside model code in the project reports. This keeps proper encapsulation of paperwork and code for each individual project.
In conclusion, Wayfair uses model-view-controller(MVC) architecture to generate lightweight, Jupyter friendly tools in data pipeline abstractions and data scientists spend so much time to generate images that meet user’s requirements. Hoover empower data scientist helps to a newbie to get onboard on existing projects. Additionally, new ETL pipelines allow the data scientist to focus more on data science tasks instead of software engineers. Hence, it is clear that Wayfair data science technology is up to date and effective, but their investment decisions were not accurate.
References
- Wikipedia, “en.wikipedia.org,” [Online]. Available: https://en.wikipedia.org/wiki/Wayfair.
- B. News, “www.boston.com,” 13 02 2020. [Online]. Available: https://www.boston.com/news/ business/2020/02/13/wayfair-layoffs.
- Wayfair, “tech.wayfair.com,” 11 02 2020. [Online]. Available: https://tech.wayfair.com/data-science/2020/02/how-to-enable-data-scientists-to-stop-managing-etl-pipelines-and-get-back-to-doing-data-science-part-i/.
2023 IDEAS Global Conference (Virtual)
2023 IDEAS Global AI Conference (Virtual) will take place online on November 18th, 2023.Get tickets
Job List 4 – IDEAS Southern California Conference 2018
Welcome the upcoming IDEAS Southern California Conference 2018!
In the SoCal Conference 2018, we are honored to invite many professional speakers with a background in data science. In particular, these speakers provide a rare opportunity to recommend jobs.
Come to join our Southern California Conference 2018, and meet up with our speakers.
Tickets: https://socal18.eventbrite.com/?aff=Blog. 20% off code: Blog20
There are opening positions for data science at famous companies in below:
Data Science in Healthcare Industry
Author: Zihuan Tang
The coming conference in Oct is about 3000 attendees in Los Angeles Convention Center. Healthcare and data science are the hot topics in the conference. Here is the conference page: http://bit.ly/2pk3AIj.
Data Science in healthcare is supposed to provide rigorous quantitative training and essential statistical and computing skills necessary to manage and analyze health science data to address important questions in public health and biomedical sciences.
With about 1.2 billion clinical documents being produced in the United States annually, doctors and scientists have a wealth of data to promote their research. Additionally, large amounts of health-related information are made accessible through widespread adoption of wearable computing technology, which opens up new opportunities for better, more informed healthcare.